No-Code Market Size 2026: Growth, Forecasts and Data

The global no-code AI platform market is projected to grow from roughly $8.60 billion in 2026 to $75.14 billion by 2034, a 31.13% CAGR, according to Fortune Business Insights. Growth is fueled by a multi-million-person developer shortage and a wave of non-technical "citizen developers" now building software themselves.
Table of Contents:
- Key Takeaways
- Introduction
- How Big Is the No-Code Market in 2026, and Where Is It Headed?
- What Is Actually Driving No-Code's Growth?
- Why Are SMEs the Fastest-Growing Slice of the Market?
- Which No-Code Technologies and Industries Are Pulling Ahead?
- Cloud or On-Premises: How Are Companies Deploying No-Code?
- Where Is No-Code Growing Fastest Around the World?
- Who Controls the No-Code Market, and What Could Slow It Down?
- Where Is No-Code Headed Next: Agents and Conversational Building?
- Frequently Asked Questions
Key Takeaways
- Six major research firms size the no-code market differently, and the spread between their mid-2030s forecasts runs into the hundreds of billions, which is worth pausing on.
- A shortage of millions of software developers, not marketing hype, is the real engine behind no-code adoption, and the underlying math happens to favor small operators most of all.
- Small businesses are adopting no-code faster than large enterprises, yet the per-company savings gap between the two segments points to something genuinely counterintuitive about scale.
Introduction
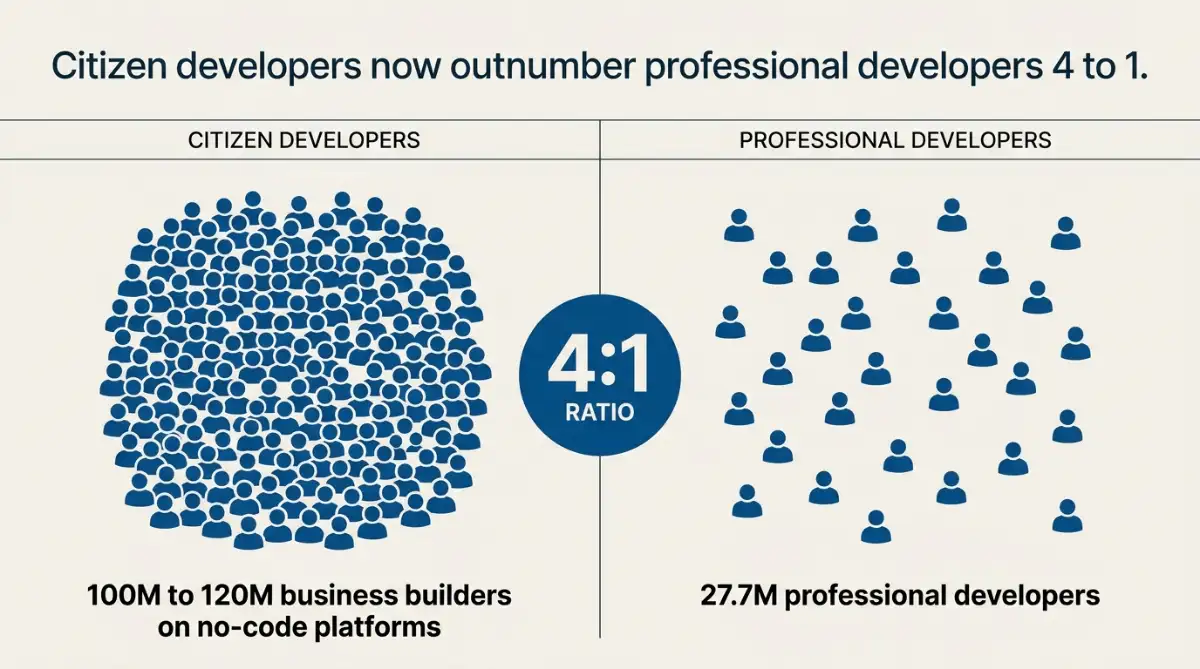
If you run a one-person agency or sell on Shopify from a spare bedroom, the most useful figure in any of this market research is buried near the top: citizen developers now outnumber career programmers by roughly four to one. Drawing on data compiled by Fortune Business Insights and other analysts, somewhere between 100 and 120 million business users are building software on no-code platforms, against about 27.7 million professional developers worldwide.
That ratio is the whole story. The freelancers, e-commerce sellers, and independent consultants who once waited on a developer's calendar are shipping working tools themselves. This article walks through how large the market actually is, why it is expanding this quickly, and which corners of it are pulling ahead through 2034.
How Big Is the No-Code Market in 2026, and Where Is It Headed?
There is no single agreed-upon figure. The broader low-code and no-code software market is projected to reach about $376.92 billion by 2034 at a 29.10% CAGR, per Fortune Business Insights, while pure-play no-code development platforms alone are forecast to reach $102.57 billion by 2030, according to Research and Markets.
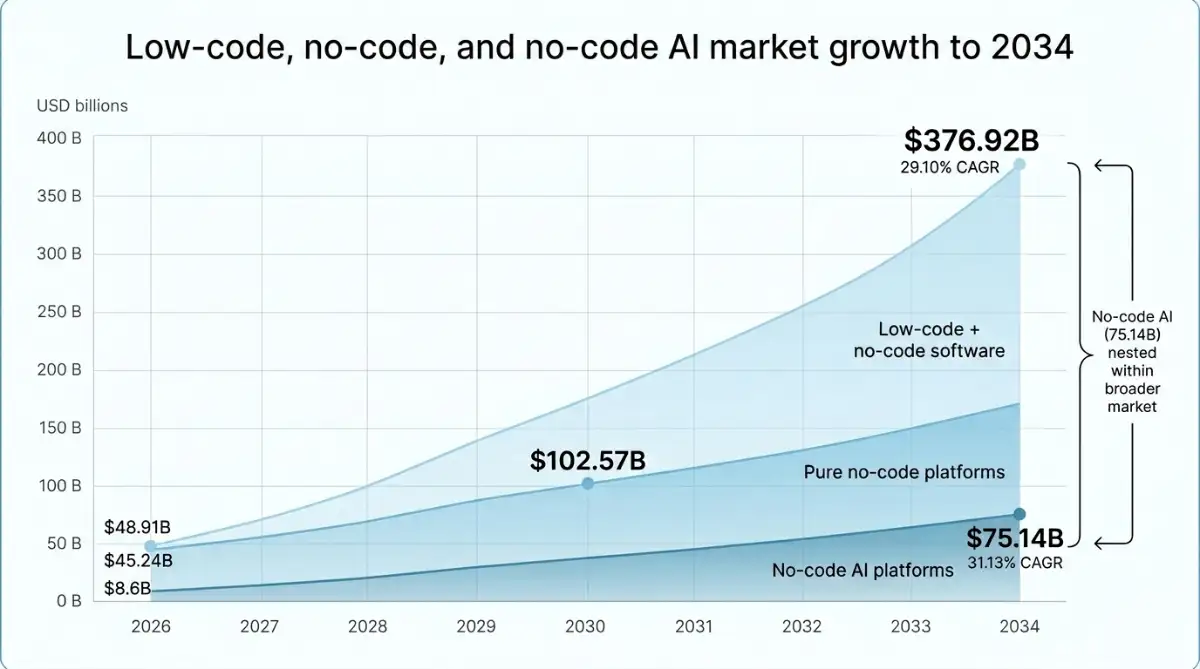
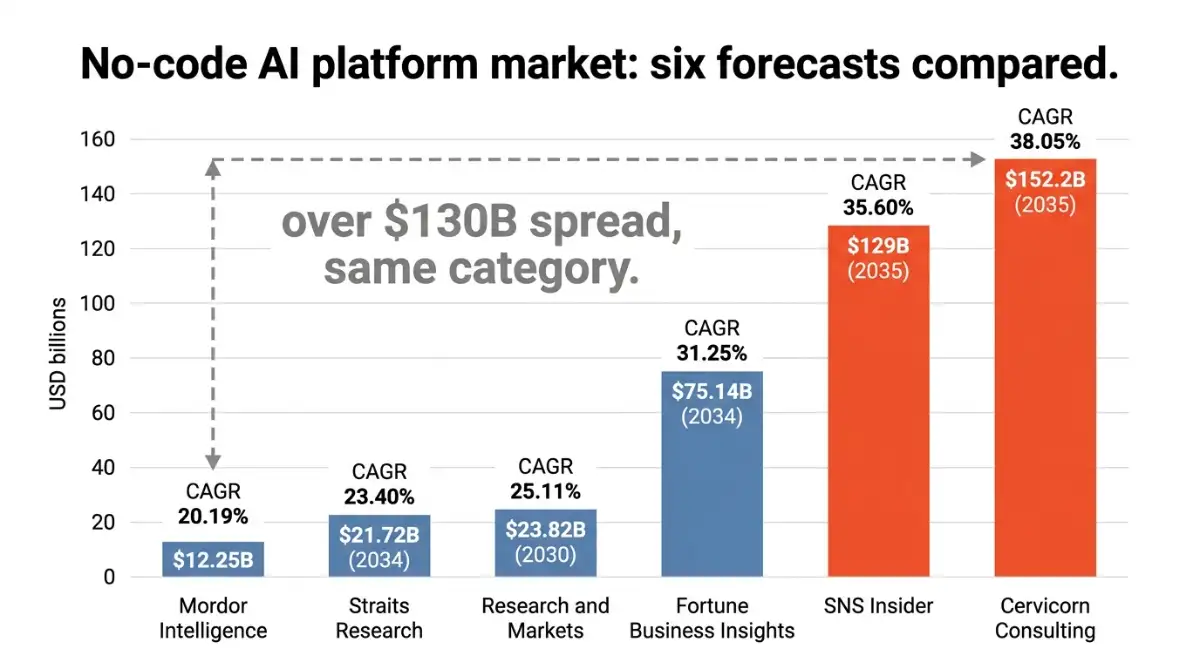
The wider gap shows up in the AI sub-segment. Depending on which firm you trust, the no-code AI platform market lands anywhere from Mordor Intelligence's modest $12.25 billion by 2031 to Cervicorn Consulting's $152.2 billion by 2035. Same product category, a difference of well over $100 billion. The divergence comes down to definitions: some models count only the visual software, while others fold in cloud infrastructure, hardware accelerators, and consulting.
Same product category, six research firms, and a spread of more than $100 billion in the mid-2030s forecasts: read every headline number with the methodology in mind.
Here is how the major no-code AI platform forecasts stack up.
| Research firm | 2026 value (USD B) | Terminal forecast (USD B) | Terminal year | Projected CAGR |
|---|---|---|---|---|
| Fortune Business Insights | $8.60 | $75.14 | 2034 | 31.13% |
| SNS Insider | $8.99 | $129.00 | 2035 | 34.44% |
| Cervicorn Consulting | $8.37 | $152.20 | 2035 | 38.05% |
| Research and Markets | $9.01 | $23.82 | 2030 | 27.50% |
| Straits Research | $4.73 | $21.72 | 2034 | 20.99% |
| Mordor Intelligence | $4.88 | $12.25 | 2031 | 20.19% |
What every model agrees on is direction. The slower forecasts and the aggressive ones both describe double-digit annual growth, which is rare consensus in market research. If you are trying to understand the difference between no-code and its closely related cousin low-code, that distinction is exactly why the numbers swing so widely.
What Is Actually Driving No-Code's Growth?
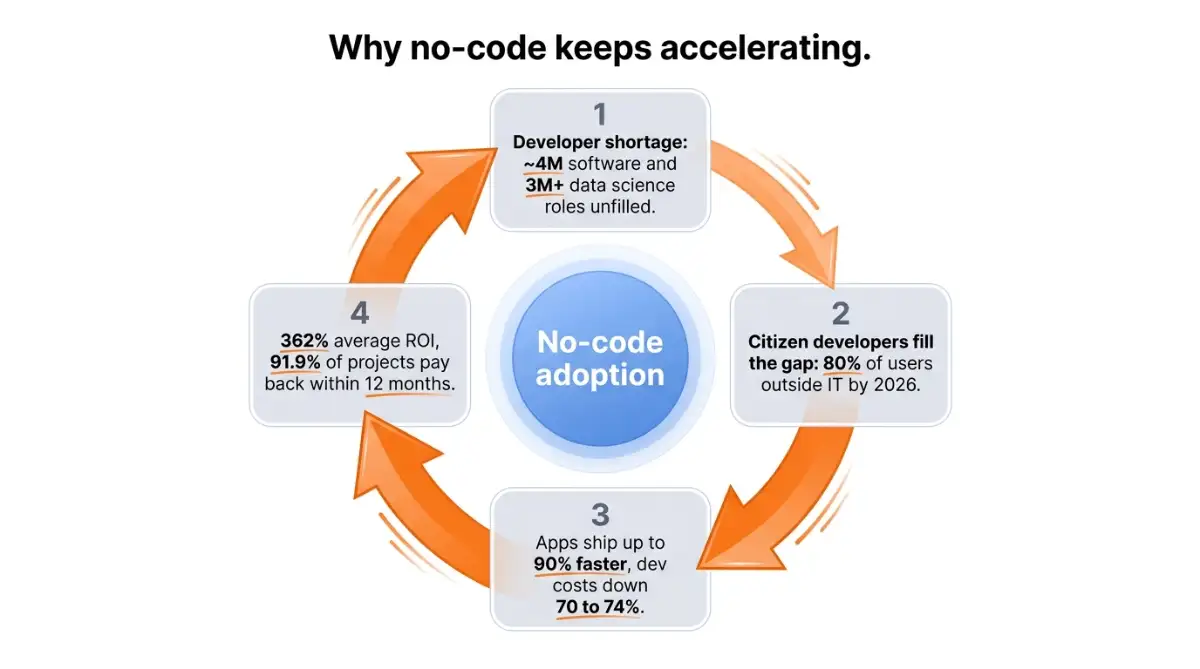
The honest answer is scarcity, not novelty. A global shortage of roughly four million full-time software developers, paired with a deficit of more than three million data science professionals, has pushed organizations toward visual development out of necessity. According to the research, this is the structural force underneath the growth charts, and broader AI spending (projected at $2.52 trillion in 2026, up 44% year over year) only amplifies it.
The economics close the case. Commissioned studies cited in the research report an average return on investment of 362% for no-code adopters, with 91.9% of projects recovering their initial investment inside the first twelve months. Development timelines compress by as much as 90%, and typical application costs drop 70% to 74%.
A few forces are stacking on top of each other:
- A talent gap that hiring cannot close. The developer shortfall is measured in millions, so even well-funded teams cannot recruit their way out of it.
- Budget moving out of central IT. Line-of-business managers now buy platform licenses directly to fix their own workflow problems, skipping procurement bottlenecks.
- Conversational building. With large language models wired into visual canvases, the rise of "vibe coding" and talk-to-build workflows lets people describe an app in plain language instead of dragging blocks.
- A genuine maker culture. The shift toward solopreneurs and citizen developers turned a workaround into a movement.
I find the trust data the most revealing part of this story. By 2026, roughly 80% of all low-code and no-code users are projected to sit outside formal IT departments, up from about 60% in 2021, which means the people building business software increasingly do not report to a CTO.
The single clearest driver is not technology at all: it is a developer shortage measured in the millions, forcing software creation out into the wider workforce.
Why Are SMEs the Fastest-Growing Slice of the Market?
Small and mid-sized enterprises sit at the sharp end of the talent shortage, and that is precisely why they are adopting no-code fastest. SMEs account for roughly 43% of the no-code AI market while growing at a projected 38.62% CAGR through 2031, according to the research, even though large enterprises still hold the larger revenue share at 57% to 72.1%.
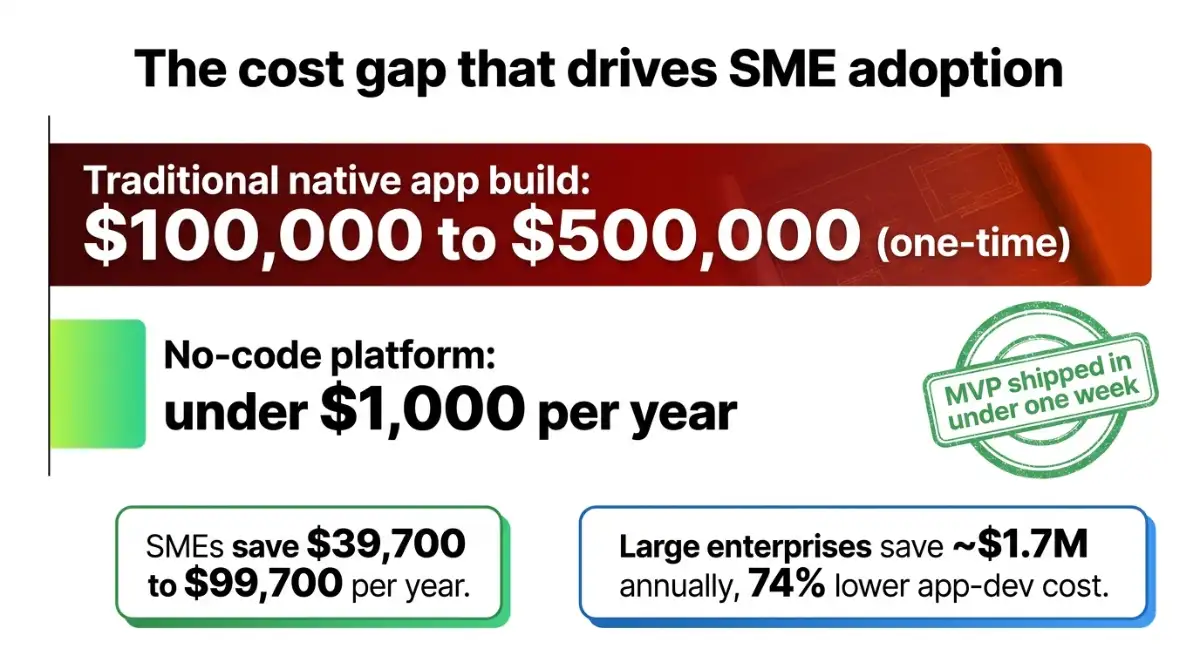
The cost contrast explains the urgency. Building a native mobile app through conventional development can run $100,000 to $500,000, while a visual no-code platform can pull the annual operating cost under $1,000. For a lean shop, that is the difference between shipping and shelving an idea. SMEs report saving between $39,700 and $99,700 a year on development, and many validate a working MVP in under a week. If you are weighing tools, our breakdown of what no-code website builders actually cost maps the price tiers in detail.
Here is the counterintuitive part. The per-company savings are larger at the top.
| Dimension | Small and mid-sized enterprises | Large enterprises |
|---|---|---|
| Estimated market share | 27.9% to 43% | 57% to 72.1% |
| Growth rate | ~38.62% CAGR (fastest segment) | Slower, broad-based |
| Typical annual savings | $39,700 to $99,700 | ~$1.7 million |
| Cost reduction reported | High, existential | 74% on app development |
| Main obstacle | Subscription cost, data literacy | Governance, legacy friction |
Large enterprises bank bigger dollar savings (an average of $1.7 million annually and a 74% cut in application development costs) because they have more processes to automate. But for SMEs the value is not a line item, it is survival, and that is why their adoption curve is steeper. About 75% of large enterprises now run at least four separate low-code or no-code platforms, which creates a governance headache that smaller teams simply do not have.
Large enterprises save more money per company, but for small businesses no-code is not a cost optimization, it is the only way the project ships at all.
Which No-Code Technologies and Industries Are Pulling Ahead?
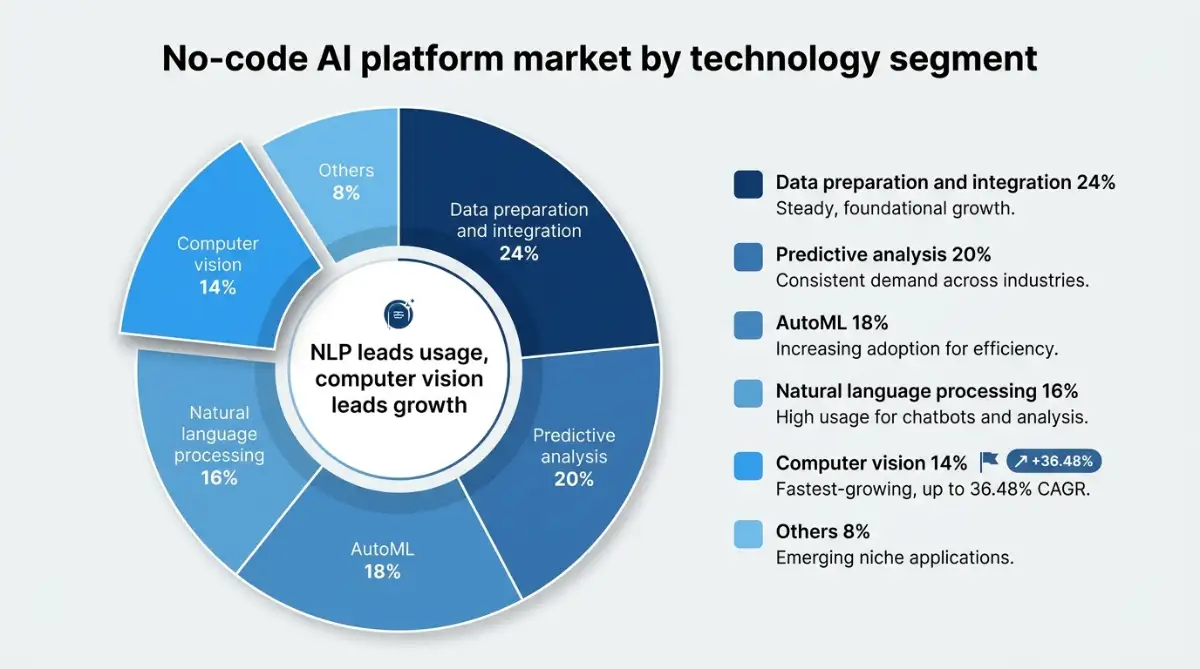
Natural language processing is the workhorse, and computer vision is the sprinter. NLP holds the largest technology share (cited between 34% and 52.4% depending on the year), driven by chatbots and customer support automation, while computer vision is the fastest-growing technical segment with a projected CAGR of 29.6% to 36.48%, according to the research.
The rest of the stack fills in around those two. Data preparation and integration tools take a steady 24% of the market and cut data-prep time by 60% to 70%, predictive analysis ranges from 20% up to 50.35% depending on classification, and AutoML holds about 18%. For a plain-language primer on how these pieces fit together, our no-code 101 explainer of visual building is a good starting point.
| Technology segment | Estimated share | Growth signal |
|---|---|---|
| Natural language processing | 16% to 52.4% | Dominant, conversational AI led |
| Data preparation and integration | 24% | Foundational across all verticals |
| Predictive analysis | 20% to 50.35% | High baseline in finance and retail |
| Automated machine learning | 18% | Rapid prototyping of custom models |
| Computer vision | 14% to ~20% | Fastest-growing, up to 36.48% CAGR |
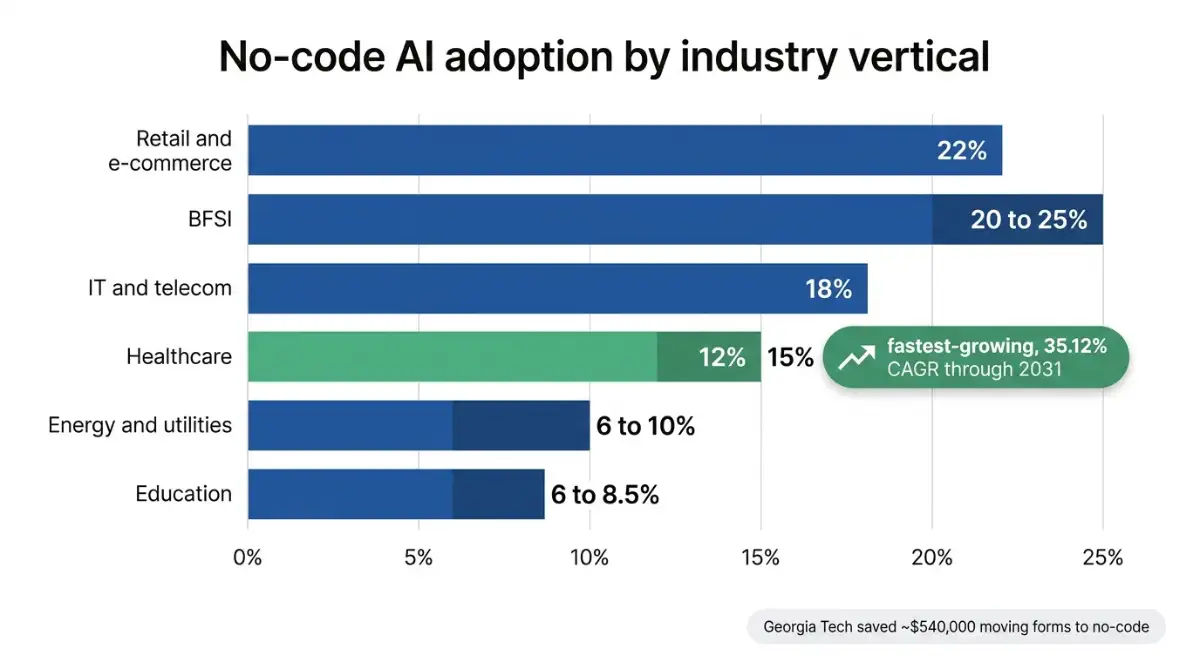
Industry adoption is just as uneven. Retail and e-commerce lead one model at 22%, BFSI commands 20% to 25%, and healthcare is the fastest-growing vertical at a 35.12% CAGR through 2031, fueled by demand for compliant patient portals and clinical admin tools. Education even has a concrete proof point: Georgia Tech saved about $540,000 in custom development costs by moving standard operations and database forms to low-code and no-code tools.
| Industry vertical | Estimated market share |
|---|---|
| Retail and e-commerce | 12% to 22% |
| BFSI (banking, finance, insurance) | 20% to 25% |
| IT and telecom | 18% to 28% |
| Healthcare | 12% to 15% (fastest-growing, 35.12% CAGR) |
| Energy and utilities | 6% to 10% |
| Education | 6% to 8.5% |
Healthcare's pace comes with a caveat: it adopts cautiously, leaning on private cloud deployments to satisfy HIPAA and patient-privacy rules even as demand surges.
Cloud or On-Premises: How Are Companies Deploying No-Code?
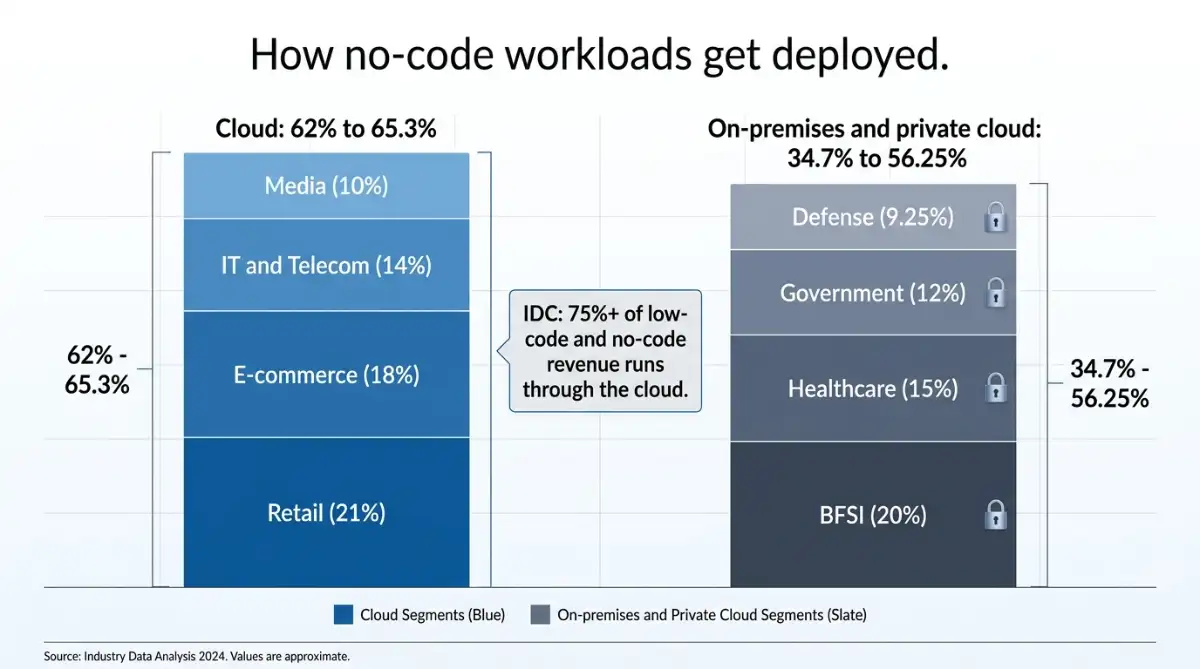
Cloud wins on volume, on-premises wins on compliance. Cloud-based deployment captured roughly 62% to 65.3% of the no-code AI market in recent estimates, and IDC expects more than 75% of all low-code and no-code revenue to flow through the cloud, while heavily regulated sectors keep workloads on-site to satisfy GDPR and HIPAA.
The appeal of cloud is mostly economic. Teams can scale machine-learning workloads up or down without buying GPUs, updates arrive automatically, and there is no server room to staff. For a freelance consultant or a small e-commerce team, that pay-as-you-go model is the only realistic on-ramp to AI tooling.
On-premises tells the opposite story. In banking, healthcare, government, and defense, the priority is keeping proprietary records inside the corporate firewall, so vendors now ship turnkey private stacks such as the HPE private-cloud solution and IBM Watsonx private clusters to run visual workflows without public-cloud routing.
| Deployment mode | Estimated share | Why teams pick it | Leading verticals | Example stacks |
|---|---|---|---|---|
| Cloud | 62% to 65.3% | Elastic scale, low upfront cost, automatic updates | Retail, e-commerce, IT and telecom, media | Google Vertex AI, AWS SageMaker Canvas, Azure |
| On-premises and private cloud | 34.7% to 56.25% | Data sovereignty, low latency, full control | BFSI, healthcare, government, defense | HPE private-cloud stack, IBM Watsonx clusters |
Note the wide on-premises range. When private cloud is grouped with on-site deployment, the regulated-heavy share climbs toward 56% in some 2025 estimates, which tells you data sovereignty still outranks convenience in banking and healthcare.
Where Is No-Code Growing Fastest Around the World?
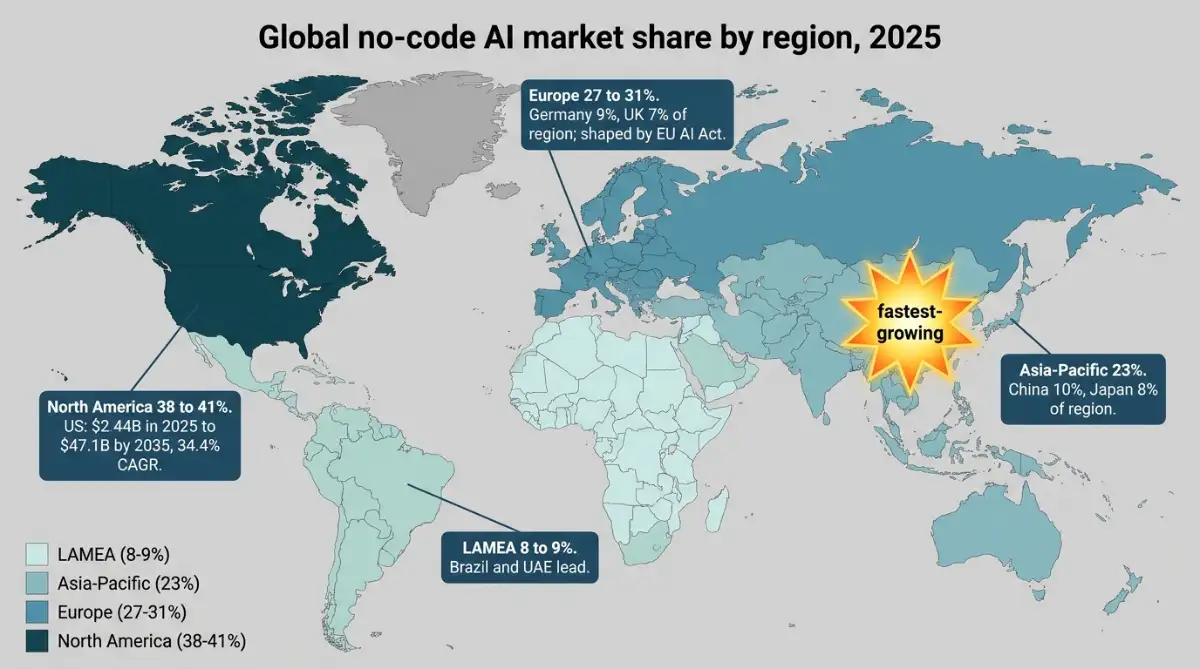
North America leads on size, Asia-Pacific leads on speed. North America holds 38% to 41% of global revenue, anchored by the United States, where the no-code AI market was valued at about $2.44 billion in 2025 and is projected to reach $47.1 billion by 2035 at a 34.4% CAGR, according to the research. Europe follows at 27% to 31%, shaped heavily by regulation.
Europe's defining feature is the EU AI Act, the world's first comprehensive AI law, which the European Parliament advanced in June 2023 before it entered into force in August 2024. That pushes European buyers toward platforms with automated compliance documentation and explainable outputs. Germany (around 9% of the regional market) leans into Industry 4.0 manufacturing use cases, while the United Kingdom (about 7%) concentrates on fintech and fraud detection.
| Region | Revenue share | 2025 value | 2035 projection |
|---|---|---|---|
| North America | 38% to 41% | $2.44B (US only) | $47.10B (US only) |
| Europe | 27% to 31% | $1.88B | $47.18B |
| Asia-Pacific | 23% | $1.39B | $35.01B |
| LAMEA | 8% to 9% | $0.48B | $12.18B |
Asia-Pacific is the growth story to watch, expanding at an estimated CAGR above 22% and in some models near 31%. China holds roughly 10% of the regional market and plans to help shape more than 20 international AI standards, while Japan turns to no-code to offset a shrinking, aging workforce. Brazil leads Latin America with about 43.8% of regional spend, and the UAE leads the Middle East and Africa at 22.8%.
Who Controls the No-Code Market, and What Could Slow It Down?
Two names sit at the top, and a pack of startups is closing fast. Microsoft holds an estimated 18% of the no-code AI platform market through its Power Platform and AI Builder, while Google follows at about 15% with AppSheet and Vertex AI, according to the research. Amazon Web Services and IBM compete as challengers, with AWS putting $50 million toward public-sector generative AI on Bedrock and SageMaker.
The startup tier is where the eye-popping numbers live. Lovable reached $400 million in annual recurring revenue and a $6.6 billion valuation by February 2026, supporting more than 25 million active projects and launching upwards of 100,000 new ones daily. Replit hit roughly $253 million ARR by October 2025, a 2,352% year-over-year jump, with non-technical teams at Coinbase, Zillow, and Mercedes-Benz building internal tools on it. On the automation side, n8n raised a $180 million Series C in 2025 at a $2.5 billion valuation, and Gumloop landed a $50 million Series B led by Benchmark.
| Player | Estimated platform share | Core offering |
|---|---|---|
| Microsoft | 18% | Power Platform, AI Builder, Copilot |
| 15% | Vertex AI, AutoML, AppSheet | |
| Amazon Web Services | Challenger | SageMaker Canvas, Bedrock |
| IBM | Challenger | Watsonx suite, hybrid governance |
| Lovable / Replit / n8n | Emerging | Conversational and agentic builders |
Now for the part the growth charts tend to skip. No-code is not frictionless, and the research is candid about it. The biggest structural limit is customization: visual interfaces are excellent for routine processes but restrict fine-tuning of model architectures and complex logic, so teams with bespoke needs still reach for traditional code.
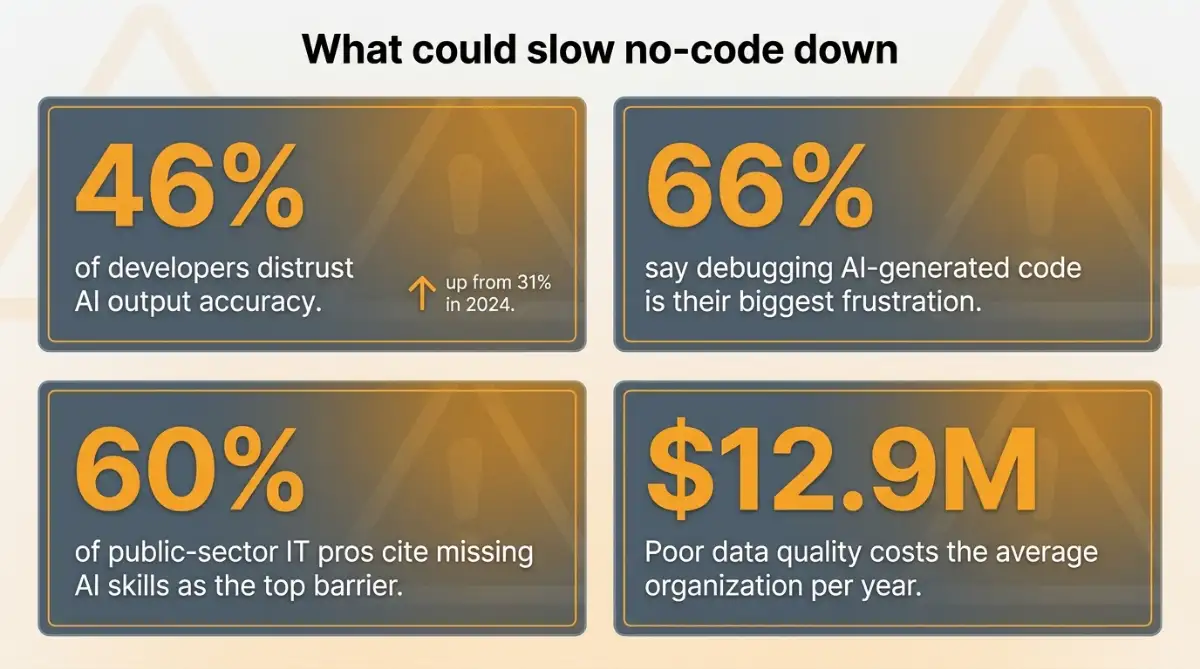
Trust is the other soft spot. Around 46% of developers do not trust the accuracy of AI tool outputs, up from 31% in 2024, and 66% call debugging AI-generated code their biggest frustration, with 45% saying it takes longer than writing the code by hand. Add a data-literacy gap (60% of public-sector IT professionals cite missing AI skills as their top barrier) and poor data quality that costs the average organization about $12.9 million a year, and the picture sharpens. For a closer look at where to draw the line, the developer middle ground of low-code is often the pragmatic answer for more complex builds.
Roughly 46% of developers distrust AI output accuracy, up from 31% a year earlier, a reminder that adoption speed and confidence are not moving in lockstep.
Where Is No-Code Headed Next: Agents and Conversational Building?
The next phase is agentic. Industry analysts project that 40% of enterprise applications will embed task-specific AI agents by the end of 2026, up from less than 5% in 2025, while large language models now let business users describe an app in plain language rather than arranging visual blocks by hand.
That is two shifts at once, and both favor the non-technical builder:
- From dragging to describing. Instead of assembling components, you state the goal in text and the platform generates the model, database, and interface around it.
- From apps to agents. Autonomous helpers run multi-step workflows, call external APIs, and make routine decisions on their own, extending the automation lineage that began with Zapier.
- From experiments to revenue. Lovable reached $400 million in ARR with more than 100,000 new projects launched daily, and Replit grew 2,352% year over year, evidence the demand is real rather than speculative.
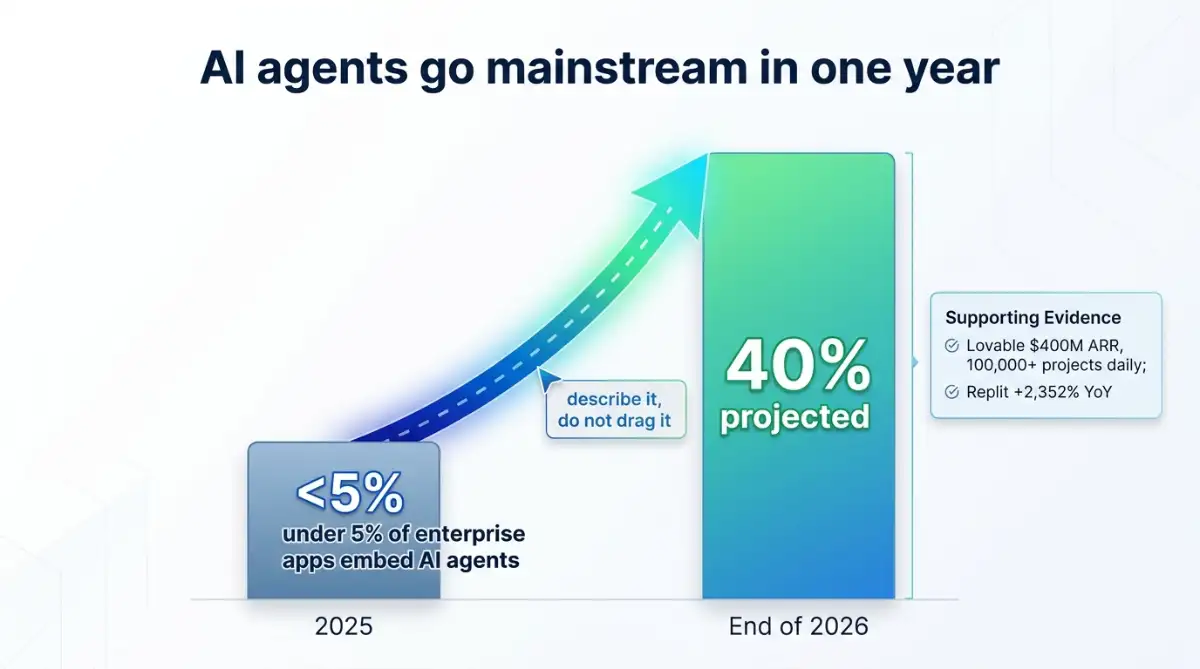
For a solo operator or a small team, the practical effect is simple: the distance between an idea and a working tool keeps shrinking. The leap from under 5% to a projected 40% of enterprise apps embedding AI agents inside a single year is one of the steepest adoption curves enterprise software has produced.
Start exploring launch-ready no-code templates here!
Frequently Asked Questions
What is no-code? No-code is a way to build software using visual, drag-and-drop interfaces and pre-built components instead of writing programming languages by hand. It lets non-technical people design, build, and ship apps, websites, and automations directly, which is why analysts describe it as the democratization of software development.
How much cheaper is no-code than custom development? The gap is large. According to the research, a native mobile app built through conventional development can cost $100,000 to $500,000, while a no-code platform can reduce the annual operating cost to under $1,000. Small businesses report saving roughly $39,700 to $99,700 per year on development.
Is no-code the same as low-code? No. No-code requires zero programming and targets business users, while low-code still expects some hand-written code and targets developers who want to move faster. The two are often grouped in market reports, which is one reason published market-size figures vary so widely between research firms.
Will no-code replace software developers? Unlikely. No-code expands who can build software rather than eliminating engineers, and citizen developers already outnumber professionals about four to one. Complex systems, custom model architectures, and core infrastructure still need traditional code, so most analysts describe the relationship as complementary rather than a replacement.
Which no-code platforms are most popular? Microsoft leads with roughly 18% market share via Power Platform, followed by Google at about 15% with AppSheet and Vertex AI. Fast-rising specialists include Lovable, Replit, n8n, and Gumloop, alongside established builders like Bubble, Airtable, and Glide for web, database, and app projects.
Start building without code
Browse thousands of no-code templates for Webflow, Framer, Bubble, Lovable, Replit and more.
Explore Templates